A Design Thinking series
Ever wonder why your Surveys come back with conflicting results? Or when you ask a User what they thought of your products and services, they’d either tell you something but act differently?
When it comes to understanding the Satisfaction Level of Users (be it internal, external customers, end-users etc.), by default we would think of conducting surveys to get their opinion. But when the results are tabulated, you are left with a conflicting result from how you gather the situation to be. It turns out that the Satisfaction Survey captures the “overall score” of the User’s experience.
Customers are not always happy or sad
According to Ram Dass, an American spiritual teacher and former clinical psychologist, “suffering is part of our training program to be wise”. In life, people are always teetering between happiness and sadness but the feeling changes at different points in life. And that is a fact of life. And probably that’s one of the many reasons why an “average score” means nothing to the business if they are looking for ways to narrow down on the root cause of the dissatisfaction.
In business, having many variables would make it more challenging to create the best strategy. But knowing where the pitfalls are and zeroing on the potential problem is a good way to identify risks and challenges. And what better to sketch out a User Journey Map?
What is a User Journey Map
User Journey Map is also known as Customer Journey Map. It is one of the tools used in Design Thinking to help us understand our Users better. It’s basically a journey map of what our User goes through, with time on the X-axis and the feelings (happiness, sadness) on the Y-axis. In short, it helps VISUALIZE the experience of the User.
Here is an example of a simple User Journey Map of a User who planned to purchase a smartphone.
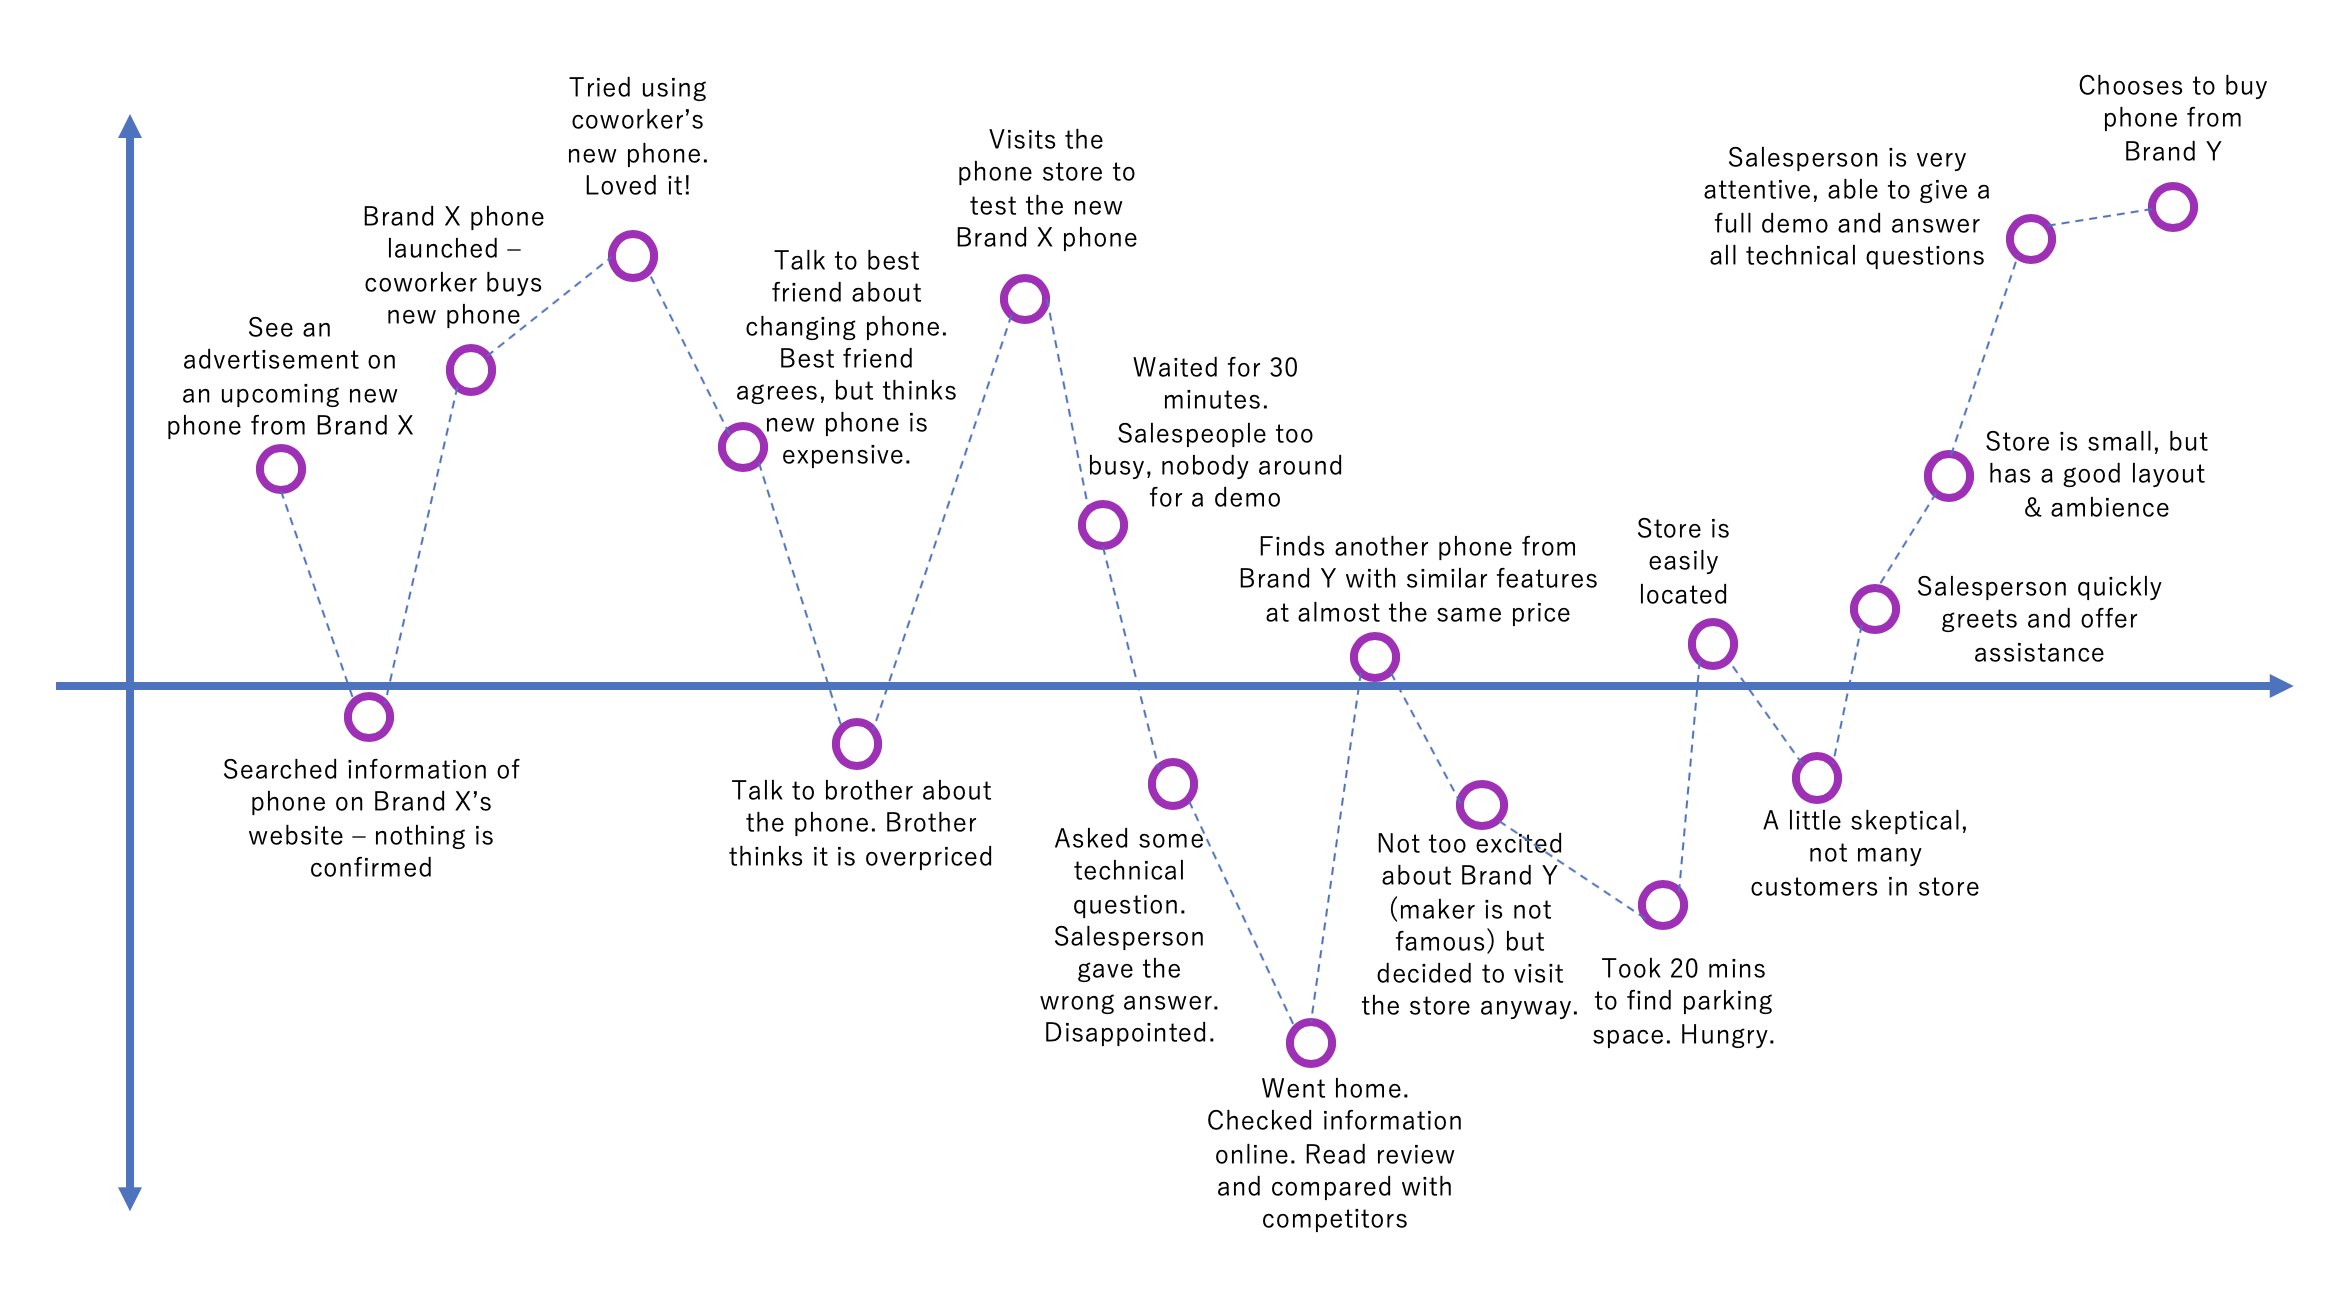
Fig. 1: Simple User Journey Map – X-axis denotes the time and the Y-axis denotes the feelings, with Happiness being on the top of the line and Dissatisfaction at the bottom
Why should we draw the User Journey Map
A User Journey Map helps businesses visualize the process that Users go through. It highlights the blind spots and potential problems that Users go through in their interaction.
In some circumstances, you might notice that there are situations that are within your control and a slight tweak or enhancement in that section could elevate the overall experience of the customers. In some cases, it might even save the business from losing their customers!

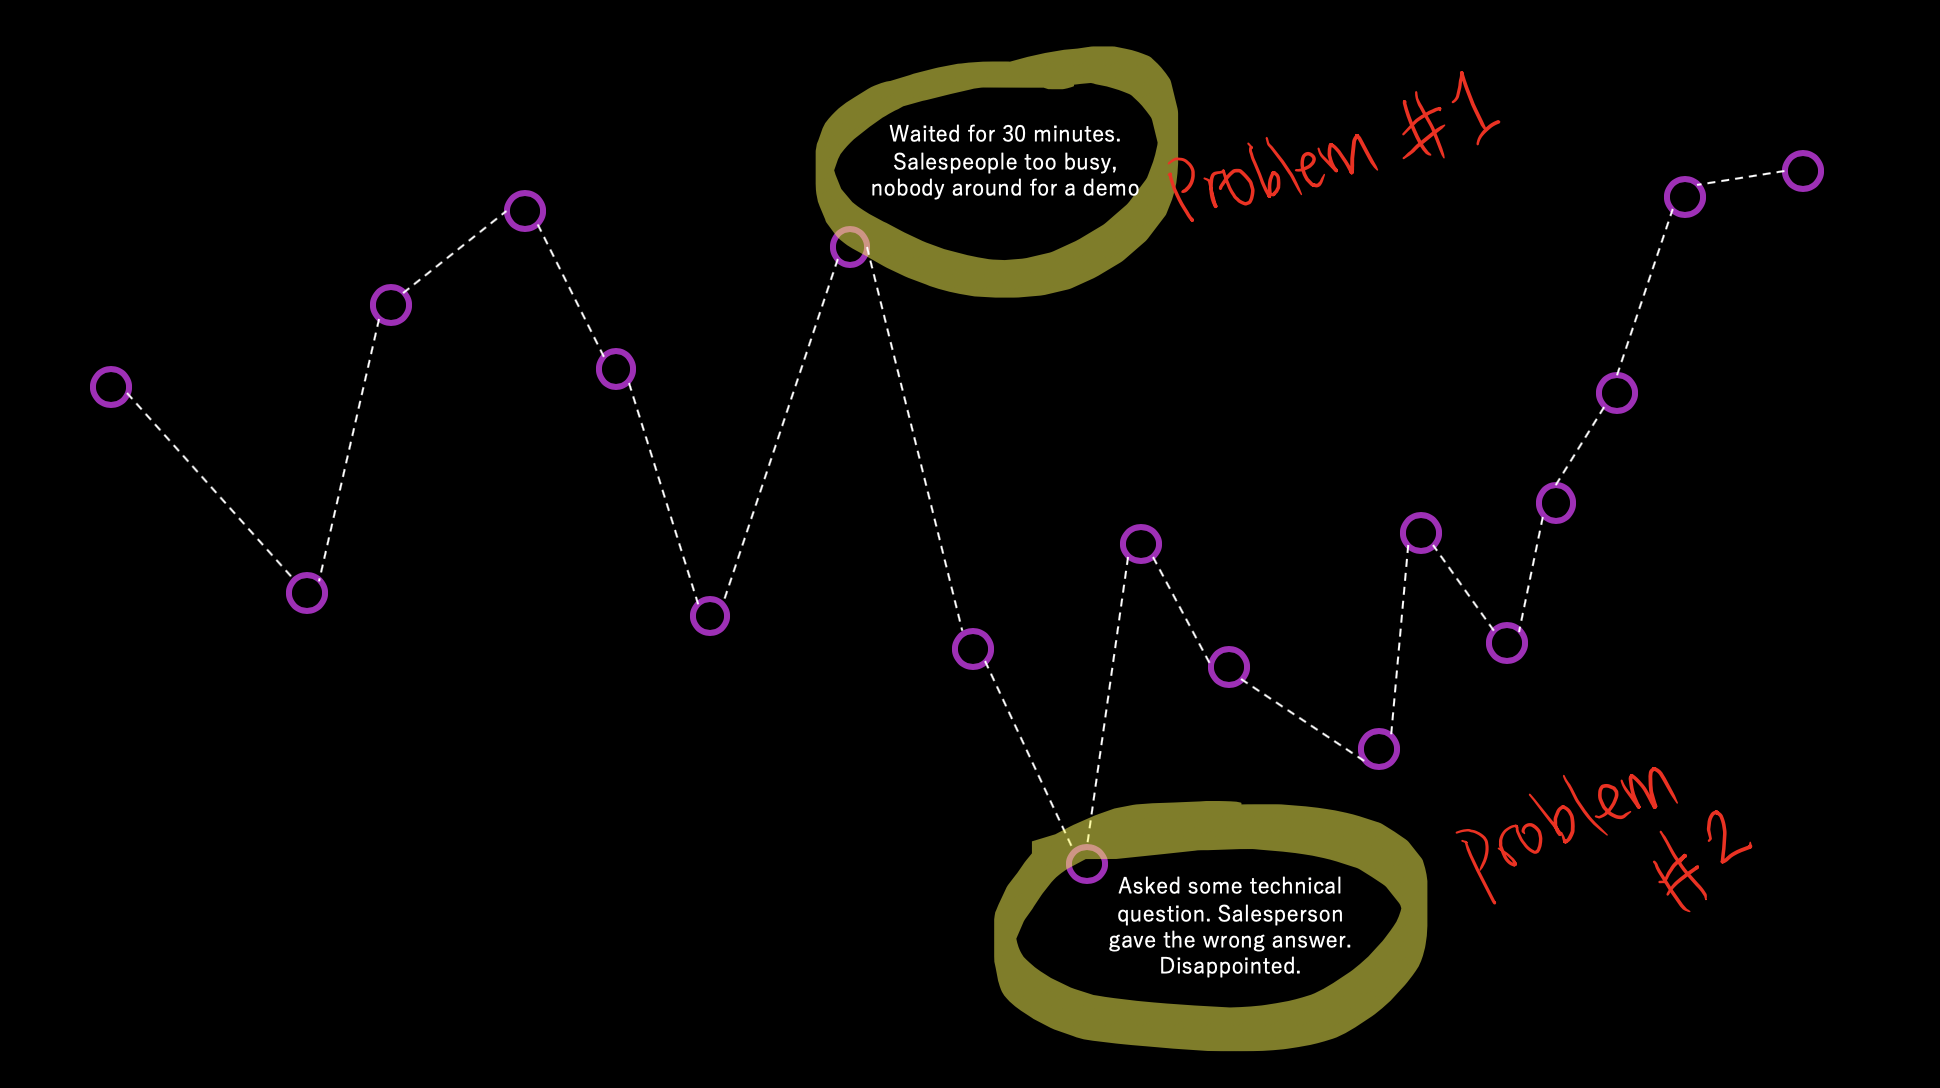
Fig. 2: Problems faced by Brand X that could have potentially saved them from losing a customer.
Looking for Opportunities
Flipping the scenario around, User Journey Map could be used to identify opportunities for the competing company as well. In the highlighted information in yellow below, Brand Y is presented a marketing opportunity to get the brand name out to the public.
And as you might have noticed in the image below (highlighted in purple), some situations are out of one’s control even though it might significantly impact the User’s experience. Such a problem is called “noise”.
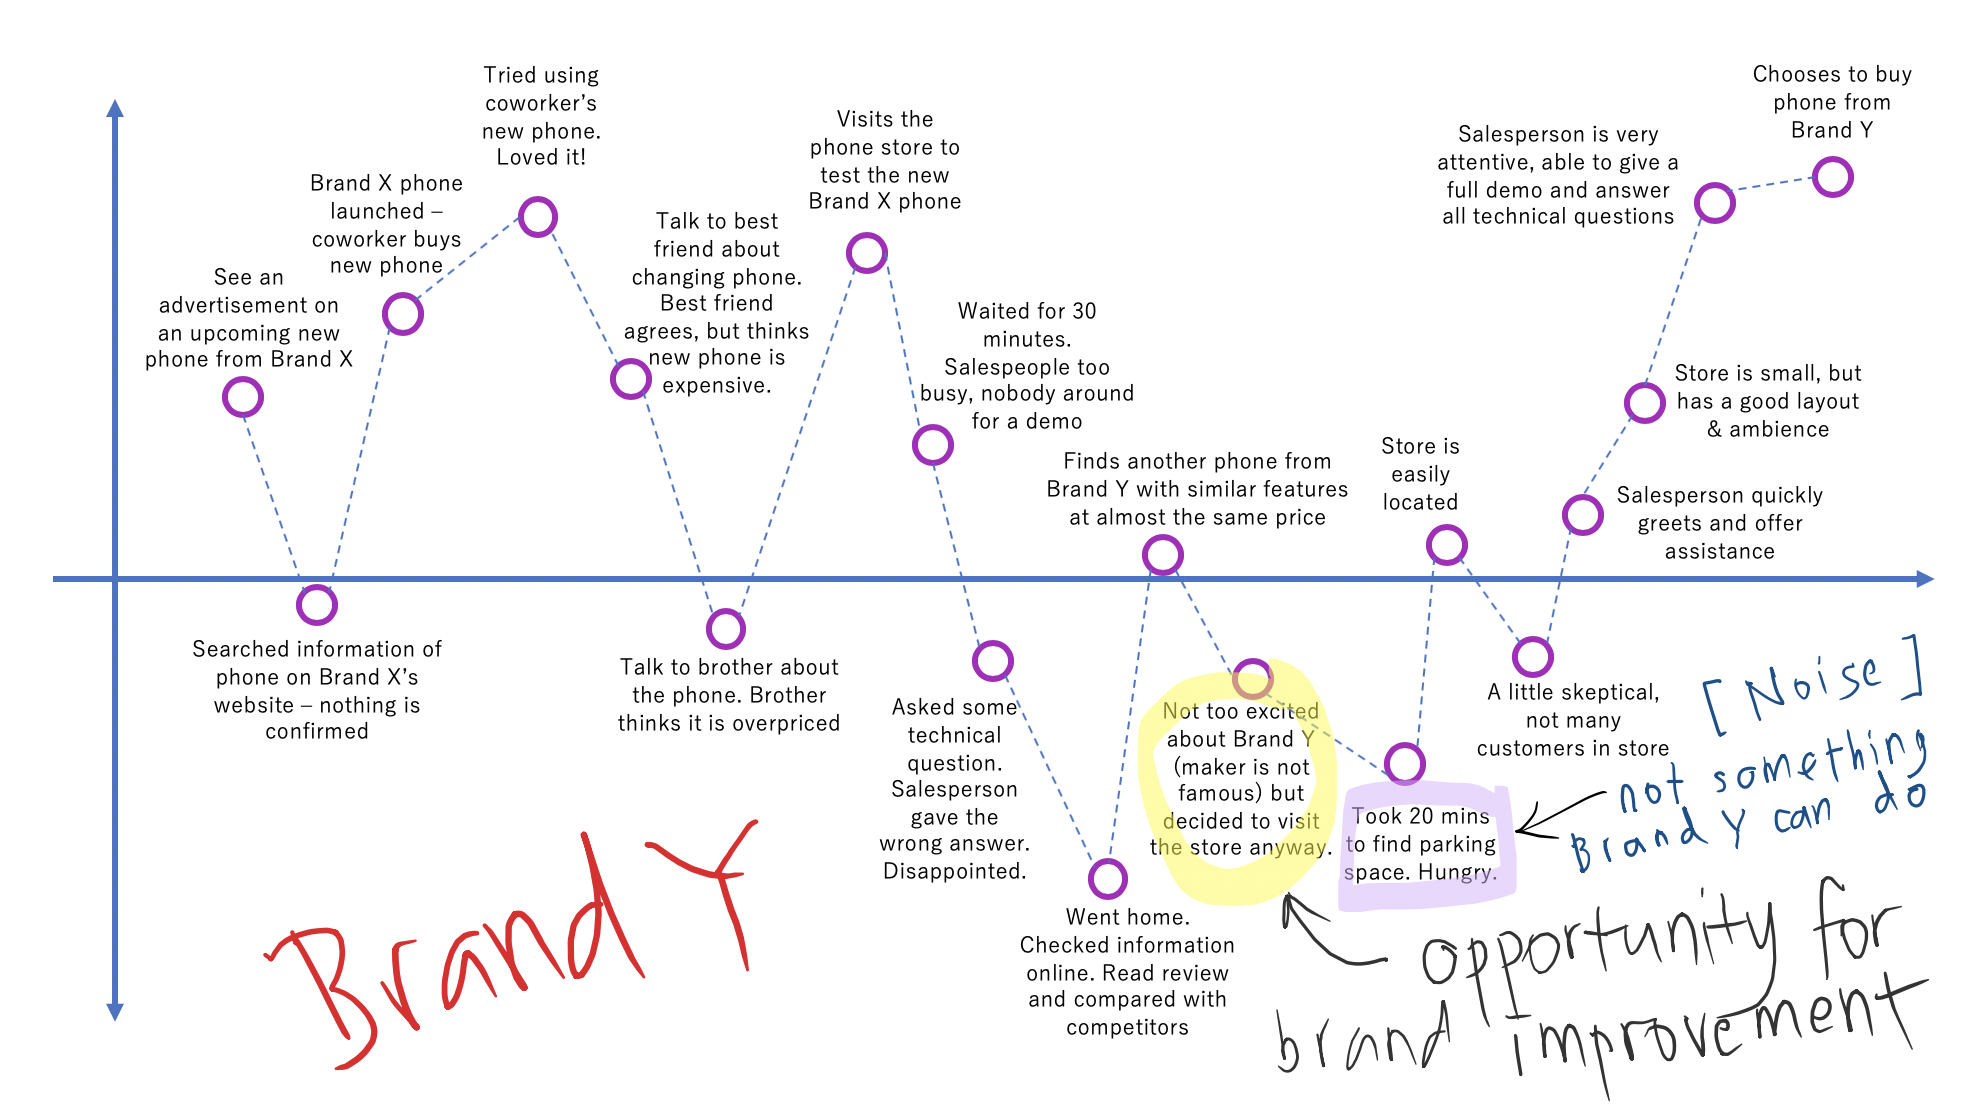
Fig. 3: Looking at the Journey Map from the perspective of the competitor.
How is User Journey Map being used
In business, User Journey Map is used to help them identify problems such as Sales Process, understanding the perspective of their (prospective) customers, and many more. Depending on what outcome is expected, the User Journey Map will incorporate more information. It could even be used to show the User’s Current State vs. User’s Future State.
In the Current State, the emphasis is on identifying weak points in the current situation.
Example: When we want to understand the user’s process of booking an airport shuttle bus on the website, we list out the steps taken by the User to achieve their outcome. It highlights the current problems faced and what Users have to go through to complete the transaction. It could also include the User deciding to not use the service due to the challenges faced.
In the Future State, we focus on desired actions that may determine an outcome.
Example: In order to make the process of booking an airport shuttle bus easier, we identify the potential problems from the current system and imagine a desired process that will alleviate the pain points in the current state. The solution could be an Application on the mobile phone that works like the Uber app that effortlessly helps users to reserve tickets and manage their bookings easily.
There are too many examples of User Journey Maps
Granted, there are many different examples of Journey Maps you could find on the internet. But the best way to start is with the basic example incorporating only two elements on the X-axis and Y-axis first. And you could slowly progress on to adding more information such as the scenario, your goals and expectations, risks and opportunities, and many more.
Here is another way you could create a User Journey Map incorporating more information
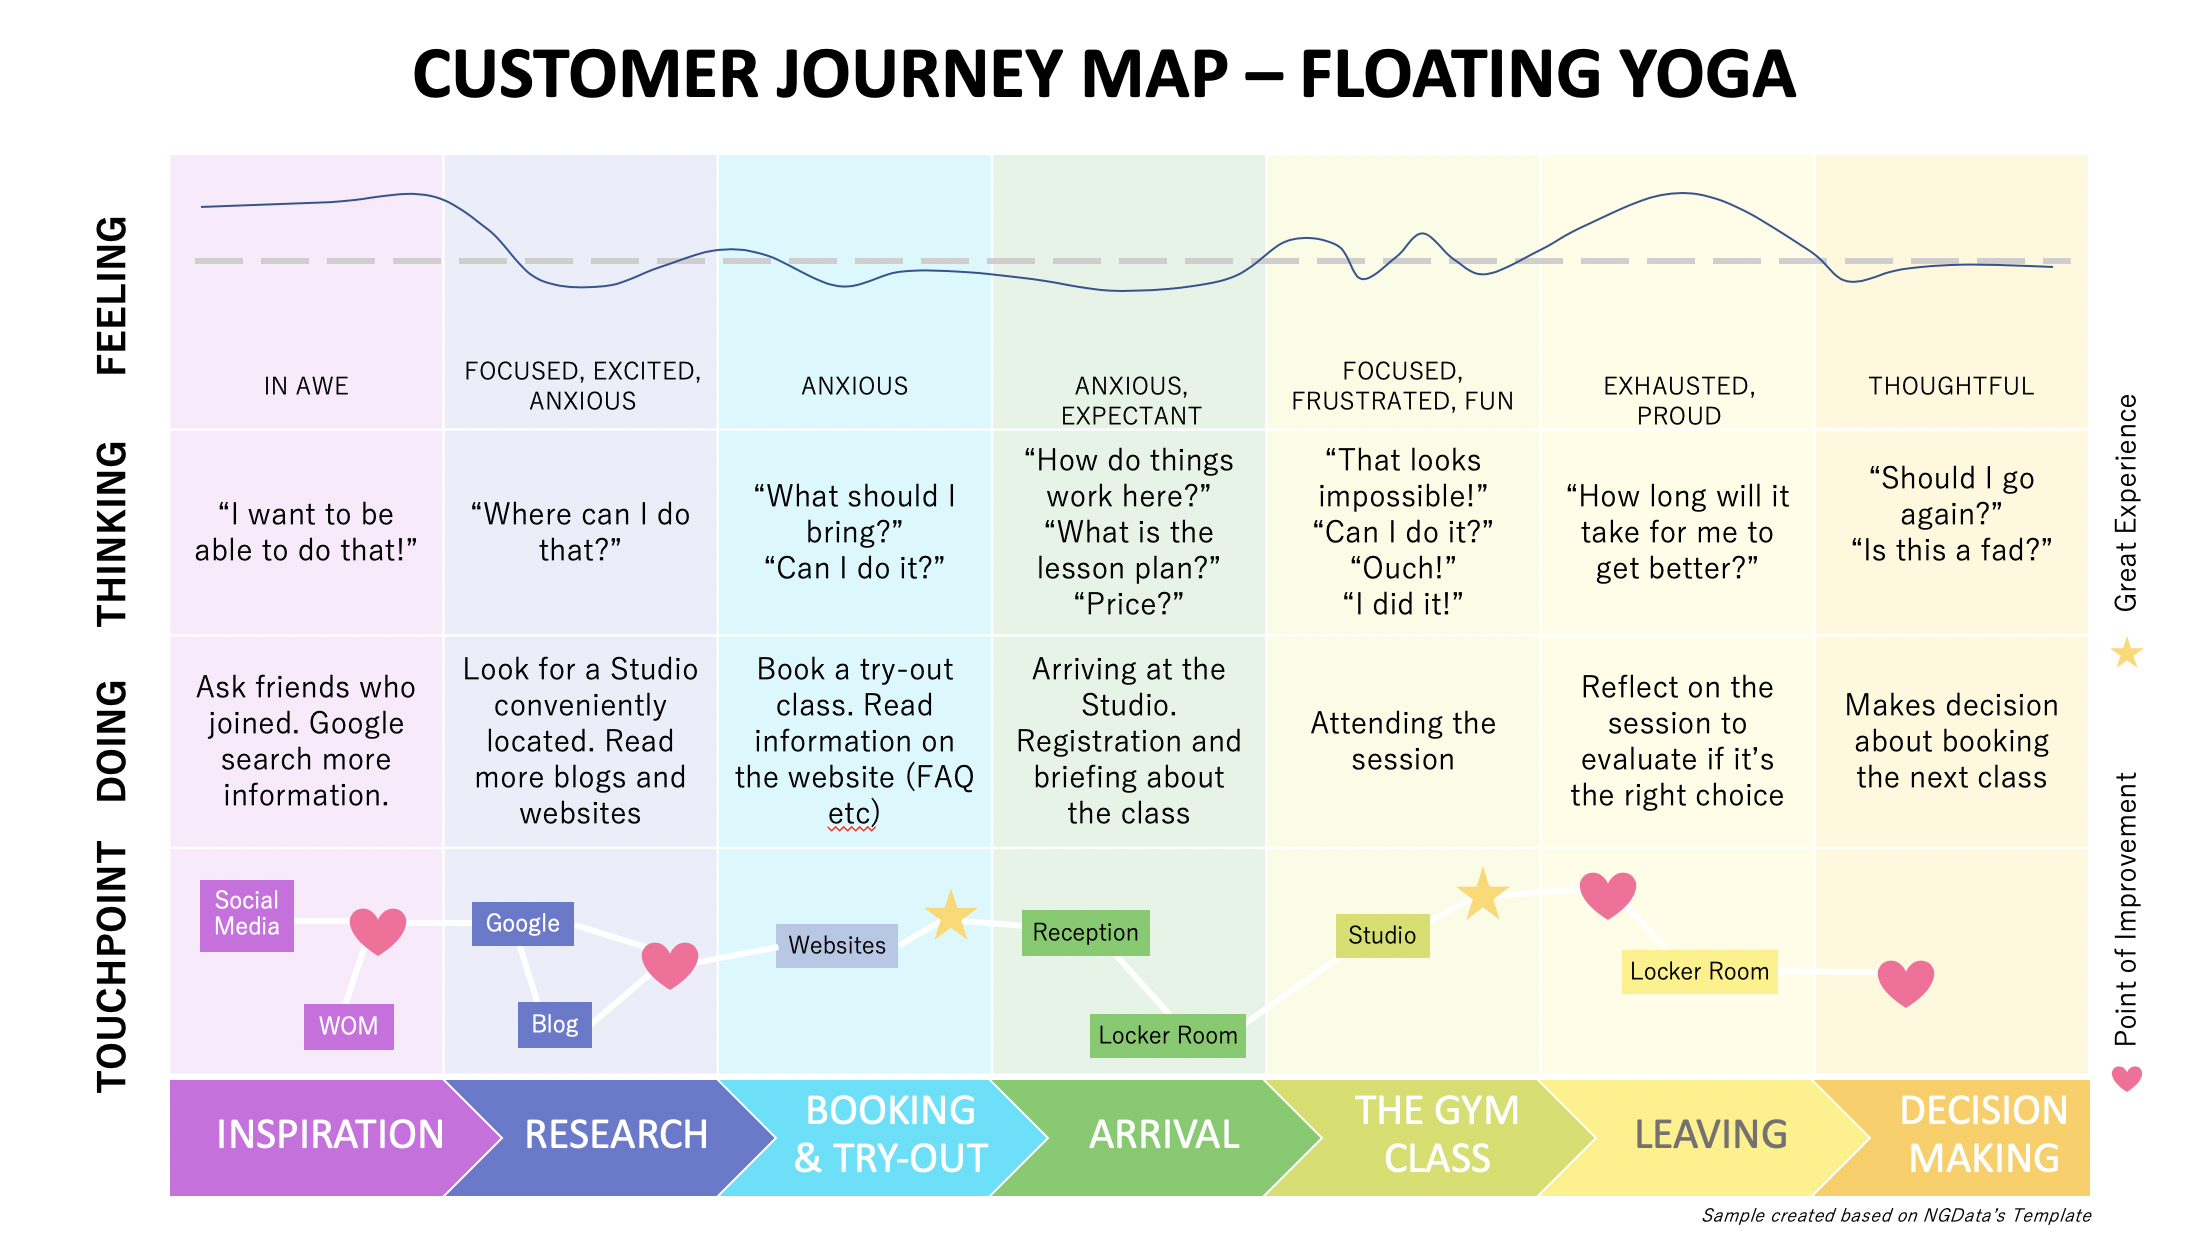
Fig. 4: A User Journey Map with more information ranging from what the User is feeling, what’s in their mind, what action did they take and the touchpoints (e.g. website, locations, etc.)
In conclusion, users are not always happy or sad in their entire journey. There will be ups and downs during the journey. But with the User Journey Map, you can identify the problematic spots in your business to elevate your user’s journey. By being able to increase their level of satisfaction, their impression of their experience will significantly be higher.